Getting started
Set up
CommitSignal turns repository activity into delivery signals for your team. Follow these steps to go from sign-in to your first insights.
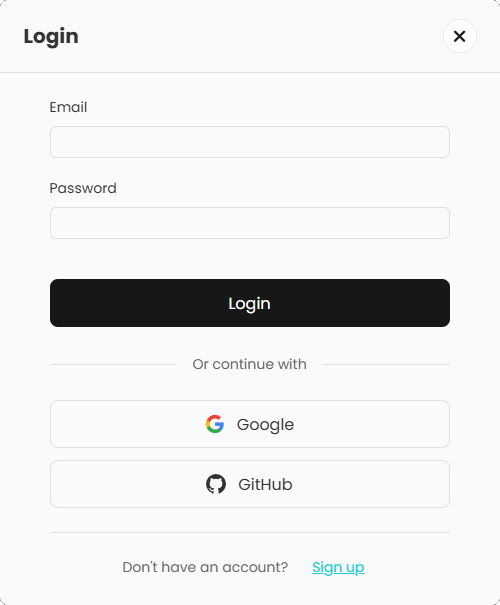
- Sign in — Create an account or sign in with email, Google, or GitHub.
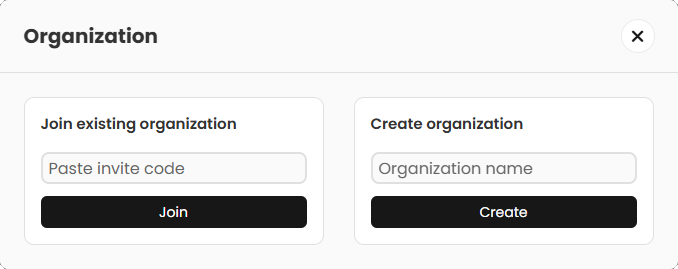
- Create or join an organization — Create a new organization for your team, or join an existing one if you have been invited.
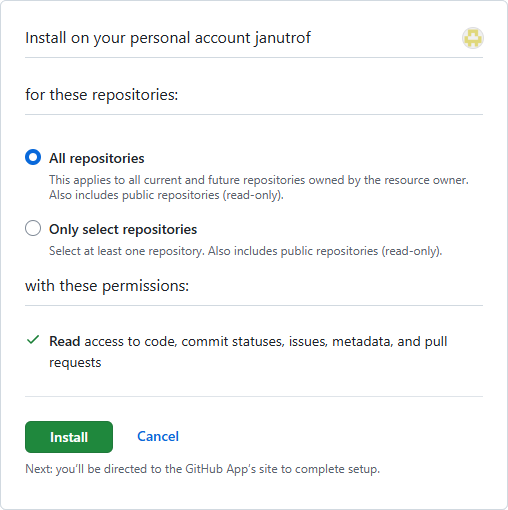
- Connect GitHub — Open Add integration and install the CommitSignal GitHub App on the organizations you want to analyze. Grant access to the repositories you plan to track.
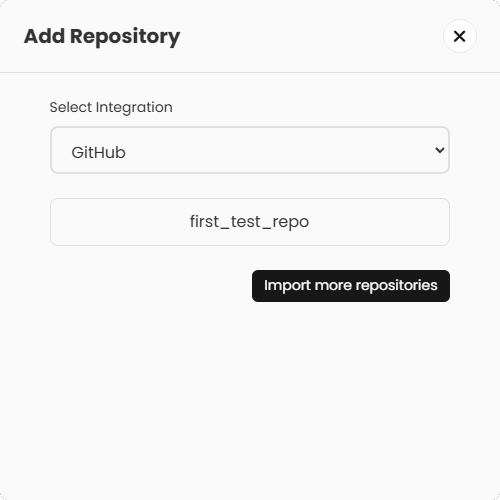
- Add repositories — Choose Add repository, pick the connected integration, and select the repos you want to track.
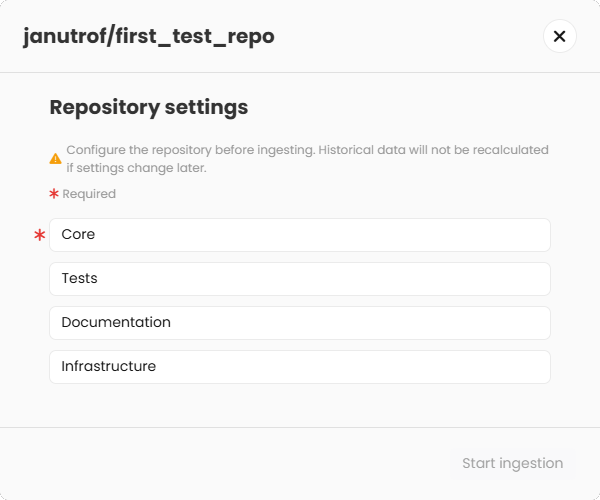
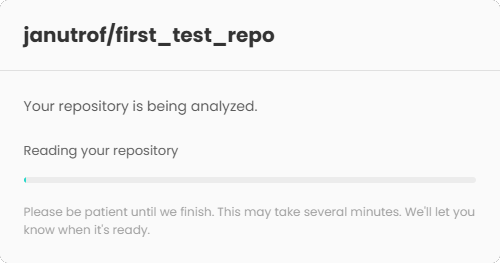
- Configure each repository — After adding a repository, CommitSignal prompts a configuration dialog before ingestion starts. Core paths are required; tests, documentation, and infrastructure paths are optional but highly recommended. Data precision depends heavily on this classification and historical data is not recalculated if you change it later, so take the time to configure each repository as accurately as possible.
- Explore insights — Open Home to review team signals, operating state, and contributor activity. Use the period selector to compare against the previous window.
Onboarding walkthrough
Live video walking through sign-in, organization setup, GitHub integration, and your first insights.
First steps
Organization view
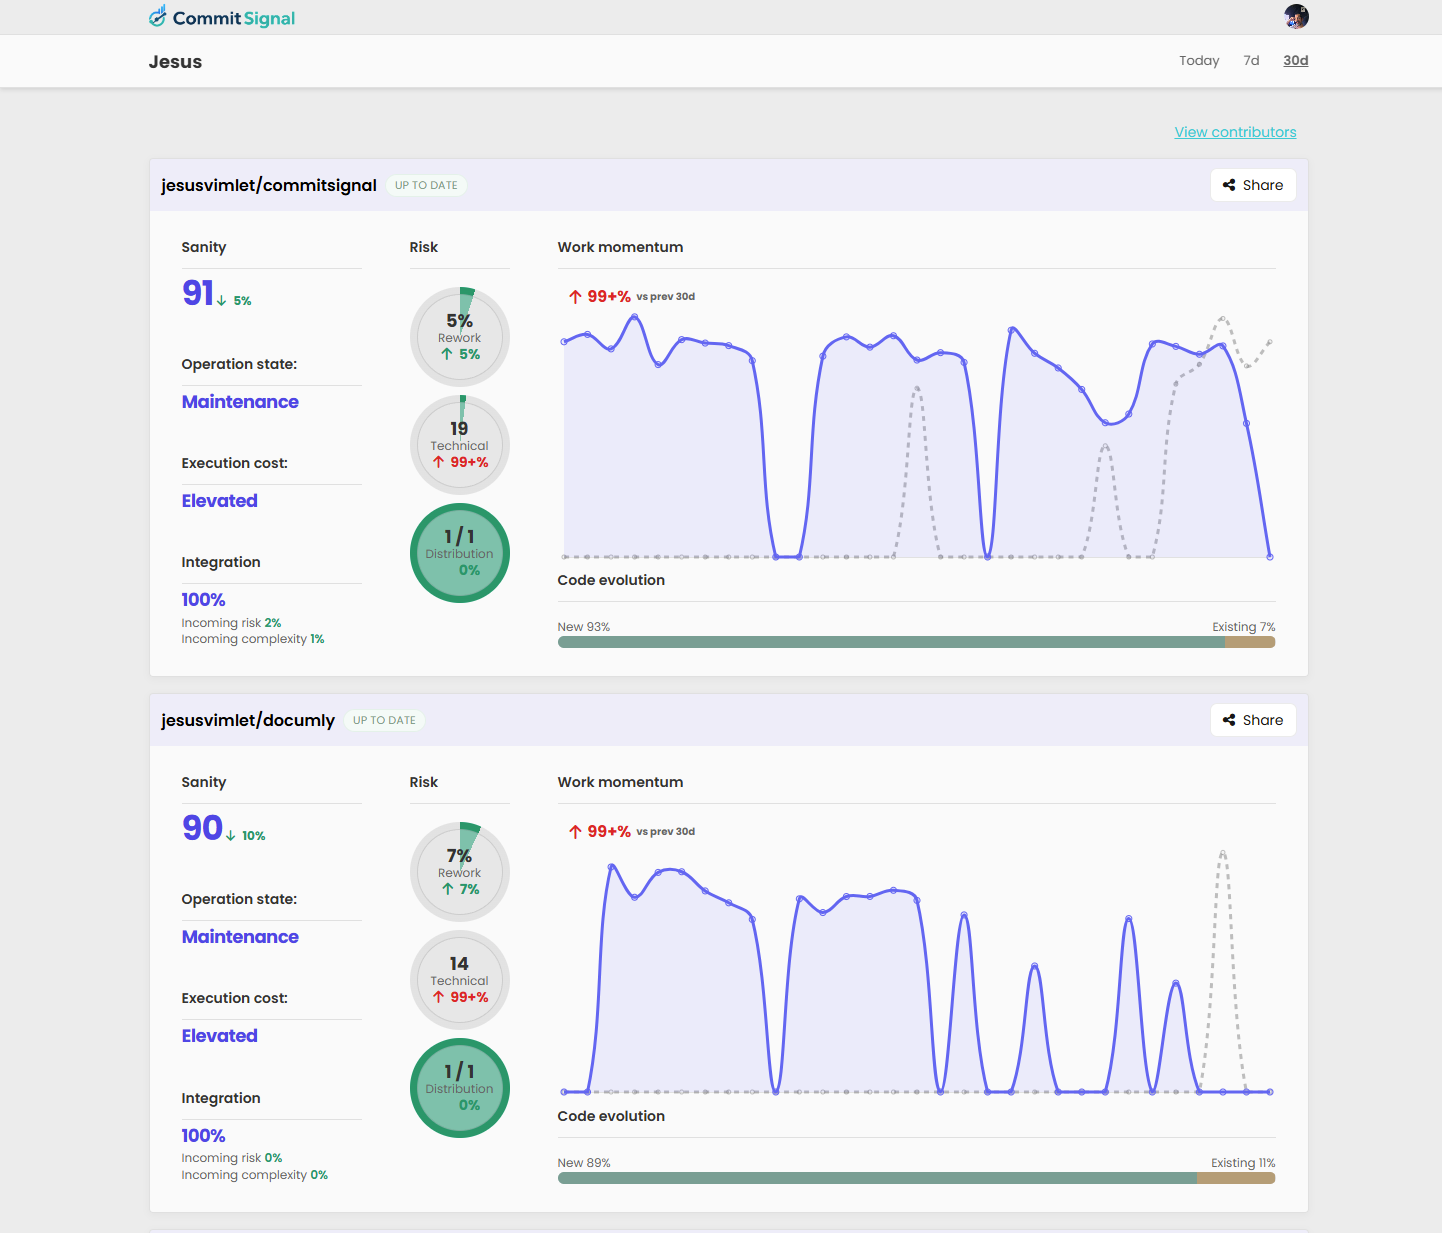
The Organization view gives you an immediate understanding of the overall state of your projects. Instead of reviewing repositories one by one, it surfaces the signals that matter most so you can quickly understand what is happening across the organization. The goal is simple: instantly know where attention is needed and where things are progressing normally. Open it, scan it, and immediately understand whether something deserves a closer look or whether you can move on.
Repository view
The Repository view helps you understand what is actually happening inside a project once something requires attention. Instead of looking at isolated metrics or raw activity, it brings together the signals that explain how the project is evolving and what may be driving changes behind the scenes. Its purpose is to help you move from detection to understanding. You can quickly see whether a project is expanding normally, accumulating friction, concentrating critical work in a small part of the team, or developing patterns that may require closer attention. The Repository view also helps you understand how work is distributed across the team. Rather than evaluating people directly, it reveals contribution patterns over time so you can identify where complex work is concentrated, how effort is evolving, and who is driving meaningful changes within the project.
Contributors view
The Contributors view gives you a complete picture of how work and effort are distributed across your organization. Instead of focusing on a single repository, it brings every contributor together in one place so you can understand what people are working on and how effort is positioned across projects. Its purpose is to help you quickly understand the human side of execution. You can see where your strongest contributors are concentrated, how work is distributed between repositories, and how each person's contribution evolves over time without needing to jump between projects.
Repository view
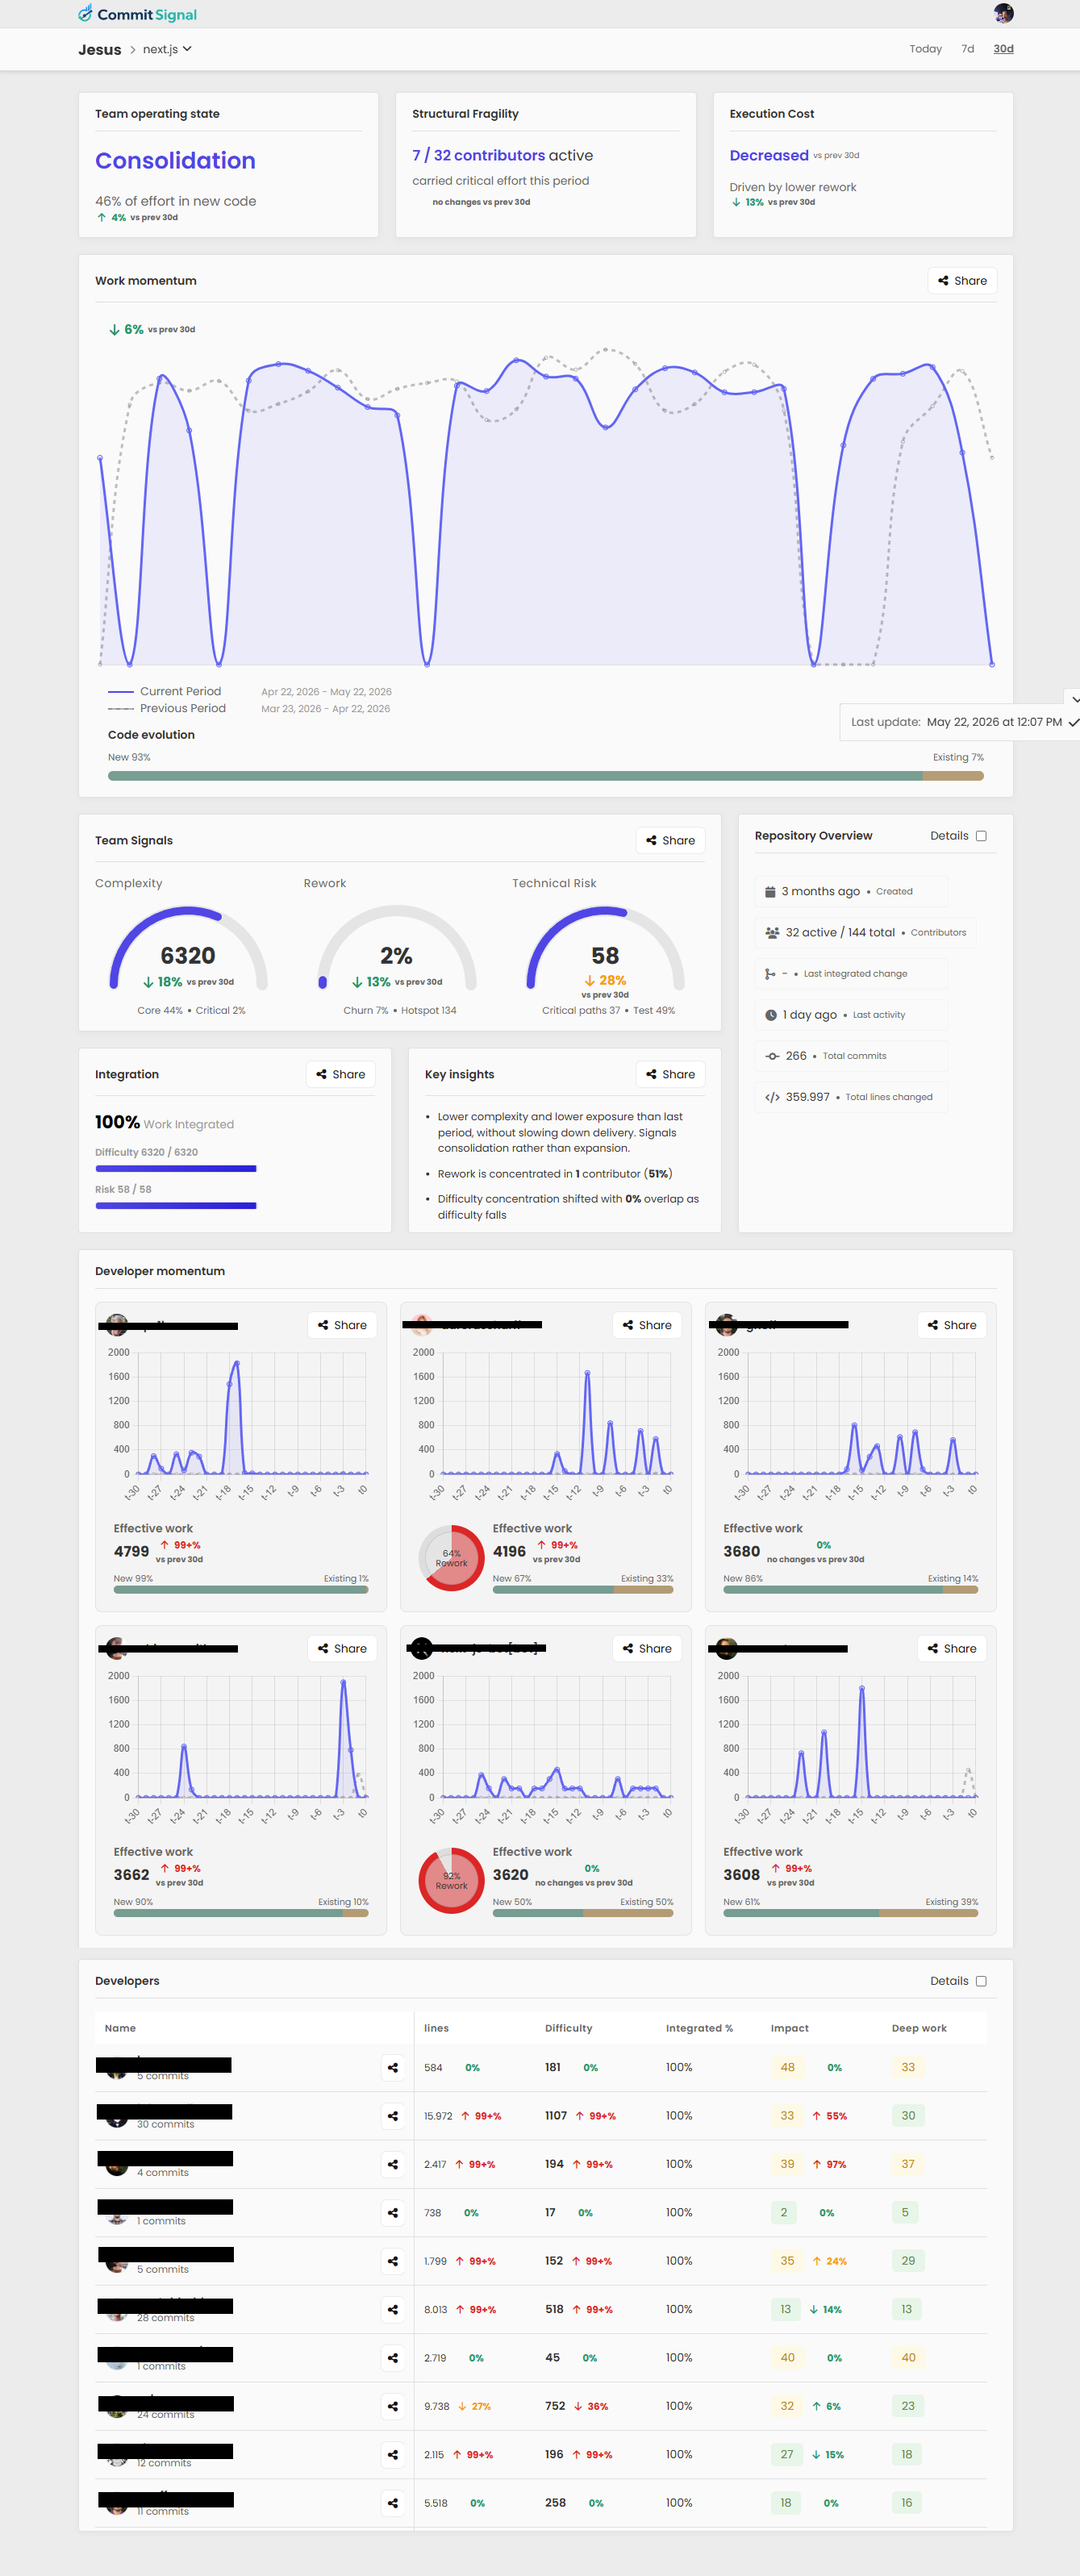
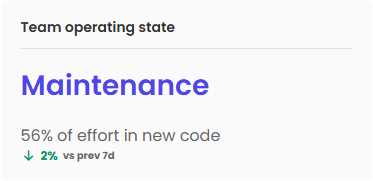
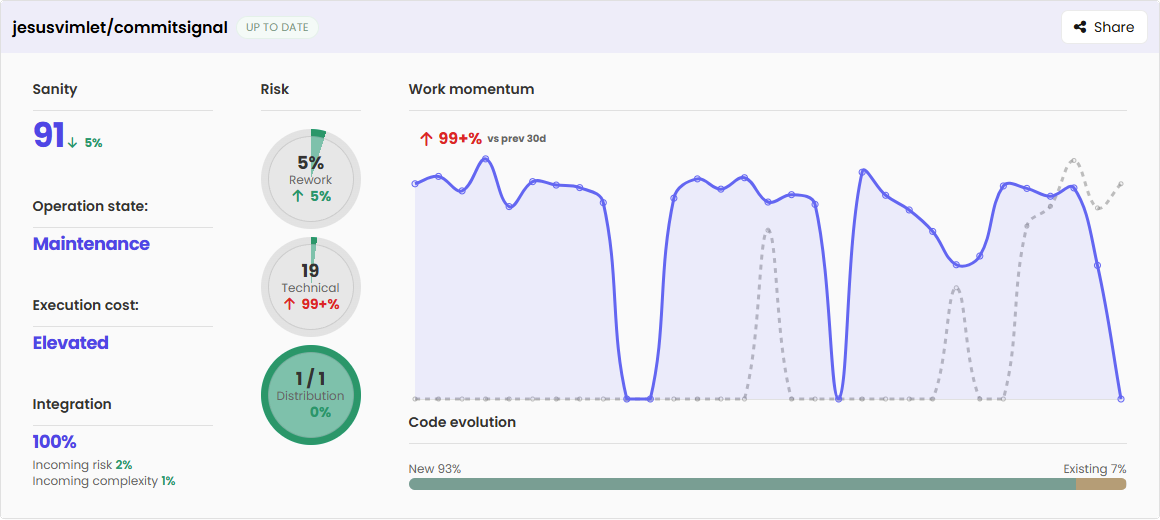
Team operating state
Team Operating State gives you a quick interpretation of how a repository is behaving during the selected period. Instead of forcing you to infer meaning from isolated metrics, it summarizes the dominant pattern behind the team's activity and turns it into a simple state that is easier to understand at a glance.
These states are not judgments and they are not fixed labels. They simply describe the current behavior of the repository based on recent activity. A team can naturally move between different states over time depending on priorities, growth, maintenance work, or unexpected pressure.
- Firefighting — The team is spending more effort reacting to problems or instability than moving work forward.
- Consolidation — The team is stabilizing and improving existing work while reducing friction and pressure.
- Expansion — The team is actively extending the product and adding new capabilities.
- Steady — The project is progressing with a stable and predictable rhythm.
- Maintenance — The focus is on upkeep, small improvements, and keeping the system healthy.
- Unknown — There is not enough activity to confidently identify a pattern.
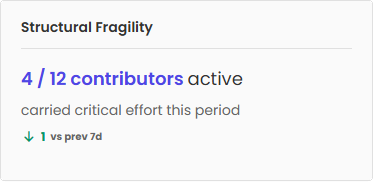
Structural fragility
Structural fragility shows how dependent delivery is on a small number of people. When critical work is distributed across more contributors, the team becomes healthier and more resilient because knowledge, ownership, and progress are not concentrated in only a few individuals.
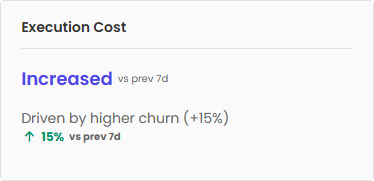
Execution cost
Execution cost shows how much effort the team needs to produce results compared with the previous period. The drivers below help explain what is influencing that change.
- Rework — More time is being spent revisiting, fixing, or repeating existing work.
- Technical risk — Changes require additional attention because they affect more sensitive or higher impact areas of the system.
- Difficulty — The work itself has become more complex and requires more effort to complete.
- Churn — The same parts of the system are being modified repeatedly, increasing the amount of work needed to make progress.
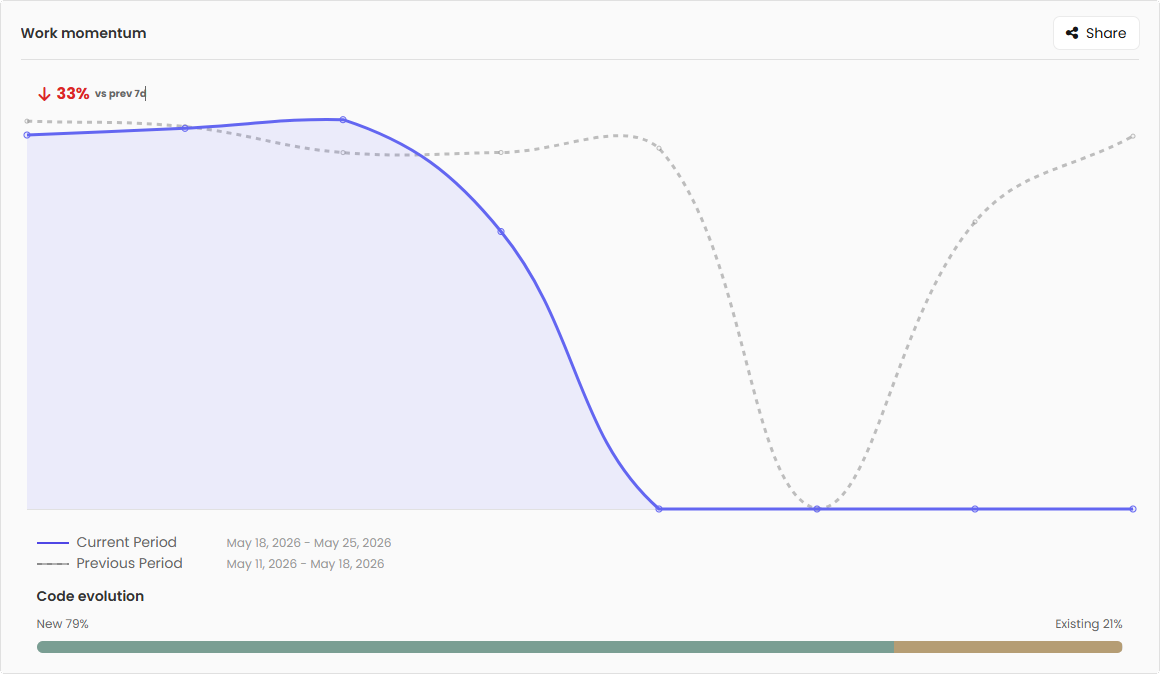
Work momentum
Work momentum helps you understand how delivery is evolving over time by comparing the current period with the previous one. It gives a quick view of whether the team is moving faster, slowing down, or maintaining a similar rhythm.
Alongside delivery movement, Code evolution shows how effort is distributed between expanding the system and evolving existing areas. This helps distinguish whether work is primarily focused on adding new capabilities or revisiting and improving what already exists.
Team signals
Team Signals provides a quick understanding of the current state of delivery by comparing the selected period against the previous one. Instead of looking at isolated activity, it helps you understand the overall pressure and behavior of the project at a glance.
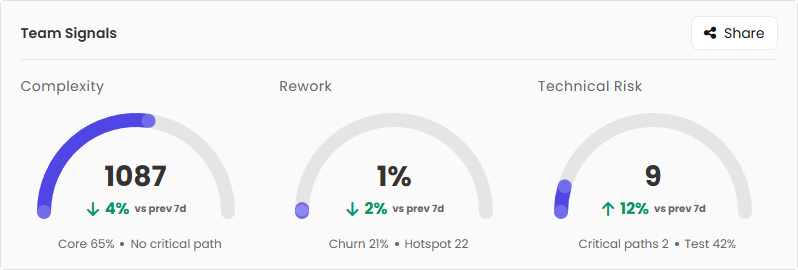
- Complexity — Shows how demanding the work being delivered is and where that effort is concentrated.
- Rework — Shows how much effort is being spent revisiting, changing, or repeating existing work instead of moving forward.
- Technical risk — Shows whether current delivery patterns are introducing areas that may require additional attention or create future pressure.
Supporting indicators provide additional context around where work is concentrated, how stable the system is, and which areas are driving the current signals.
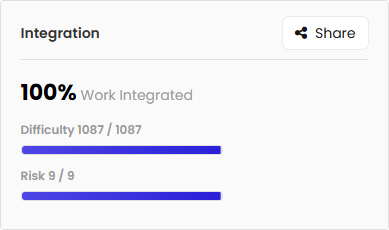
Integration
Integration shows how much of the work produced during the selected period has already been integrated into production. Beyond overall progress, it helps you understand how much of the delivered complexity and risk is already live versus still waiting to be released.
This makes it easier to distinguish between completed work and work that still has pending impact on delivery. Large amounts of complexity or risk waiting for integration can increase uncertainty, since important changes may still affect the system once they become part of production.
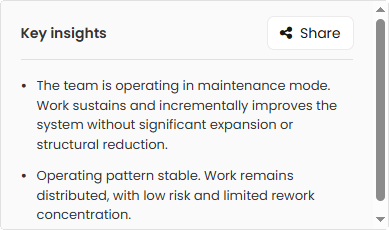
Key insights
Key insights highlight the most important patterns detected during the selected period and explain why they matter. Instead of forcing you to interpret metrics and signals yourself, they turn repository activity into short explanations focused on what changed and what may deserve attention.
Insights can explain changes in delivery patterns, shifts in how work is distributed, emerging sources of pressure, or behaviors that help explain the current state of the project.
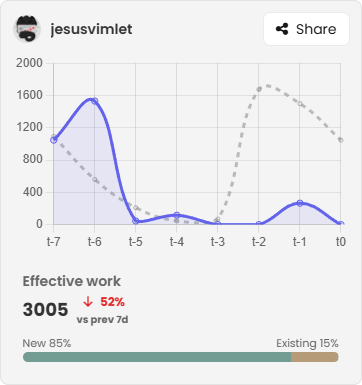
Developer momentum
Developer Momentum helps you understand how each contributor's work evolves during the selected period compared with the previous one. It provides a quick view of changes in effective work over time, making it easier to spot shifts in contribution patterns and understand how individual effort is evolving within the project.
Alongside work movement, it also shows how effort is distributed between expanding the system and evolving or revisiting existing areas. Additional signals can highlight unusual patterns, such as contributors spending a large amount of effort on rework or repeatedly revisiting the same areas.
Developers table
The Developers table provides a detailed view of contributor activity during the selected period. While the rest of the repository view focuses on trends and summaries, this table helps you understand how work is distributed across the team and what is driving those patterns.
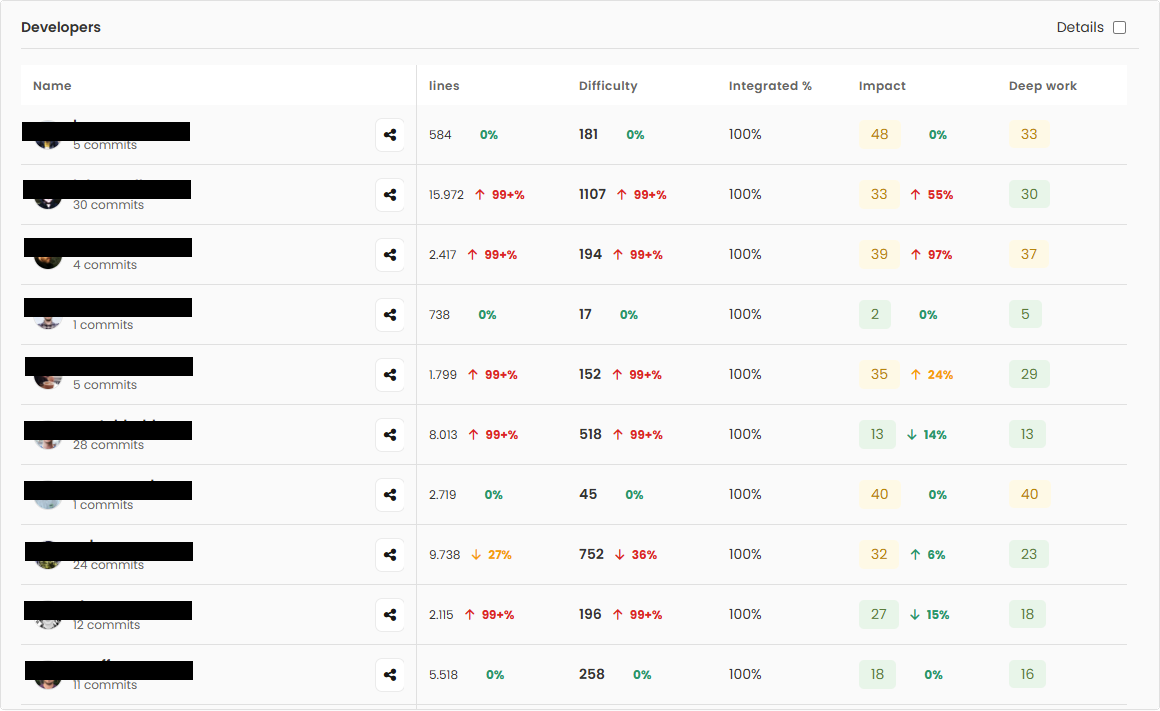
Column reference
Organization view
Home view
Organization View provides a high-level summary of every repository in your organization in a single place. Instead of reviewing projects individually, it surfaces the most important signals so you can quickly understand the current state of each repository and identify changes that may require attention.
Its purpose is simple: open the view, scan your organization in a few moments, and immediately understand whether everything is progressing normally or if a specific project deserves a closer look.
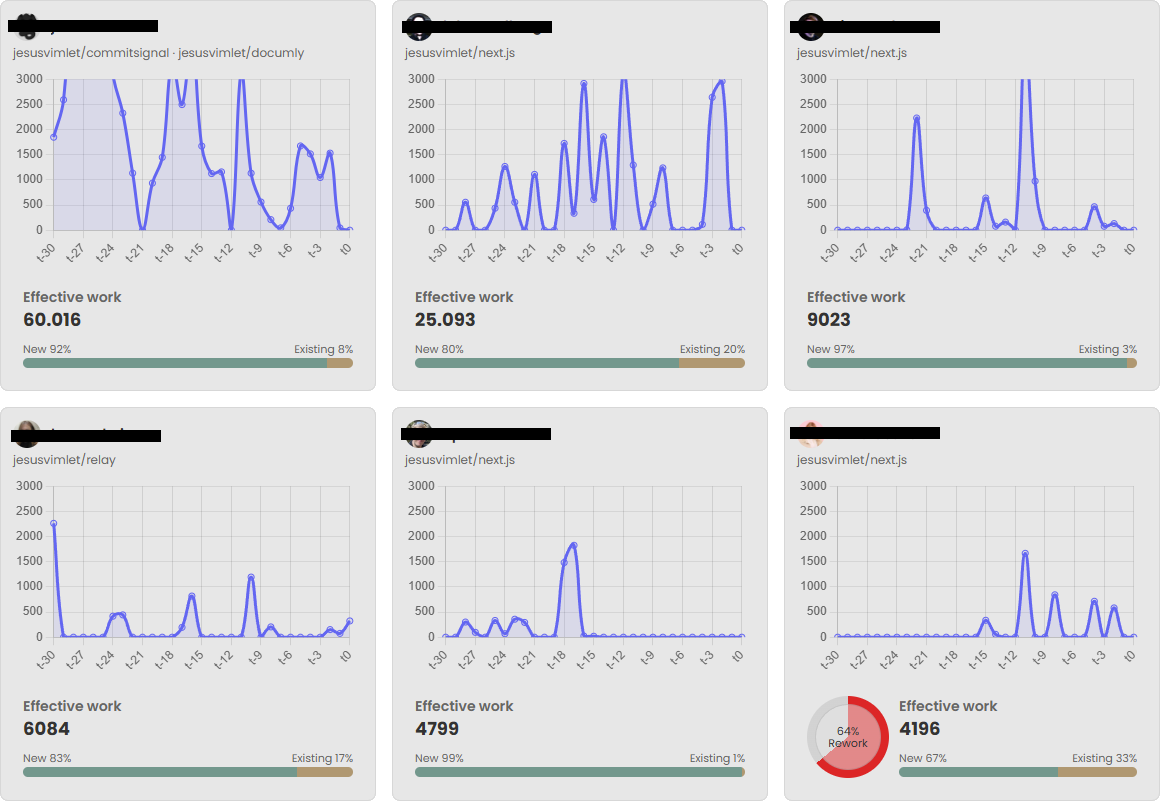
Contributors view
Introduction
Contributors View provides a complete organization-wide view of contributor activity in a single place. Instead of switching between repositories, it brings everyone together so you can quickly understand how effort is distributed across the organization and how contribution patterns evolve over time.
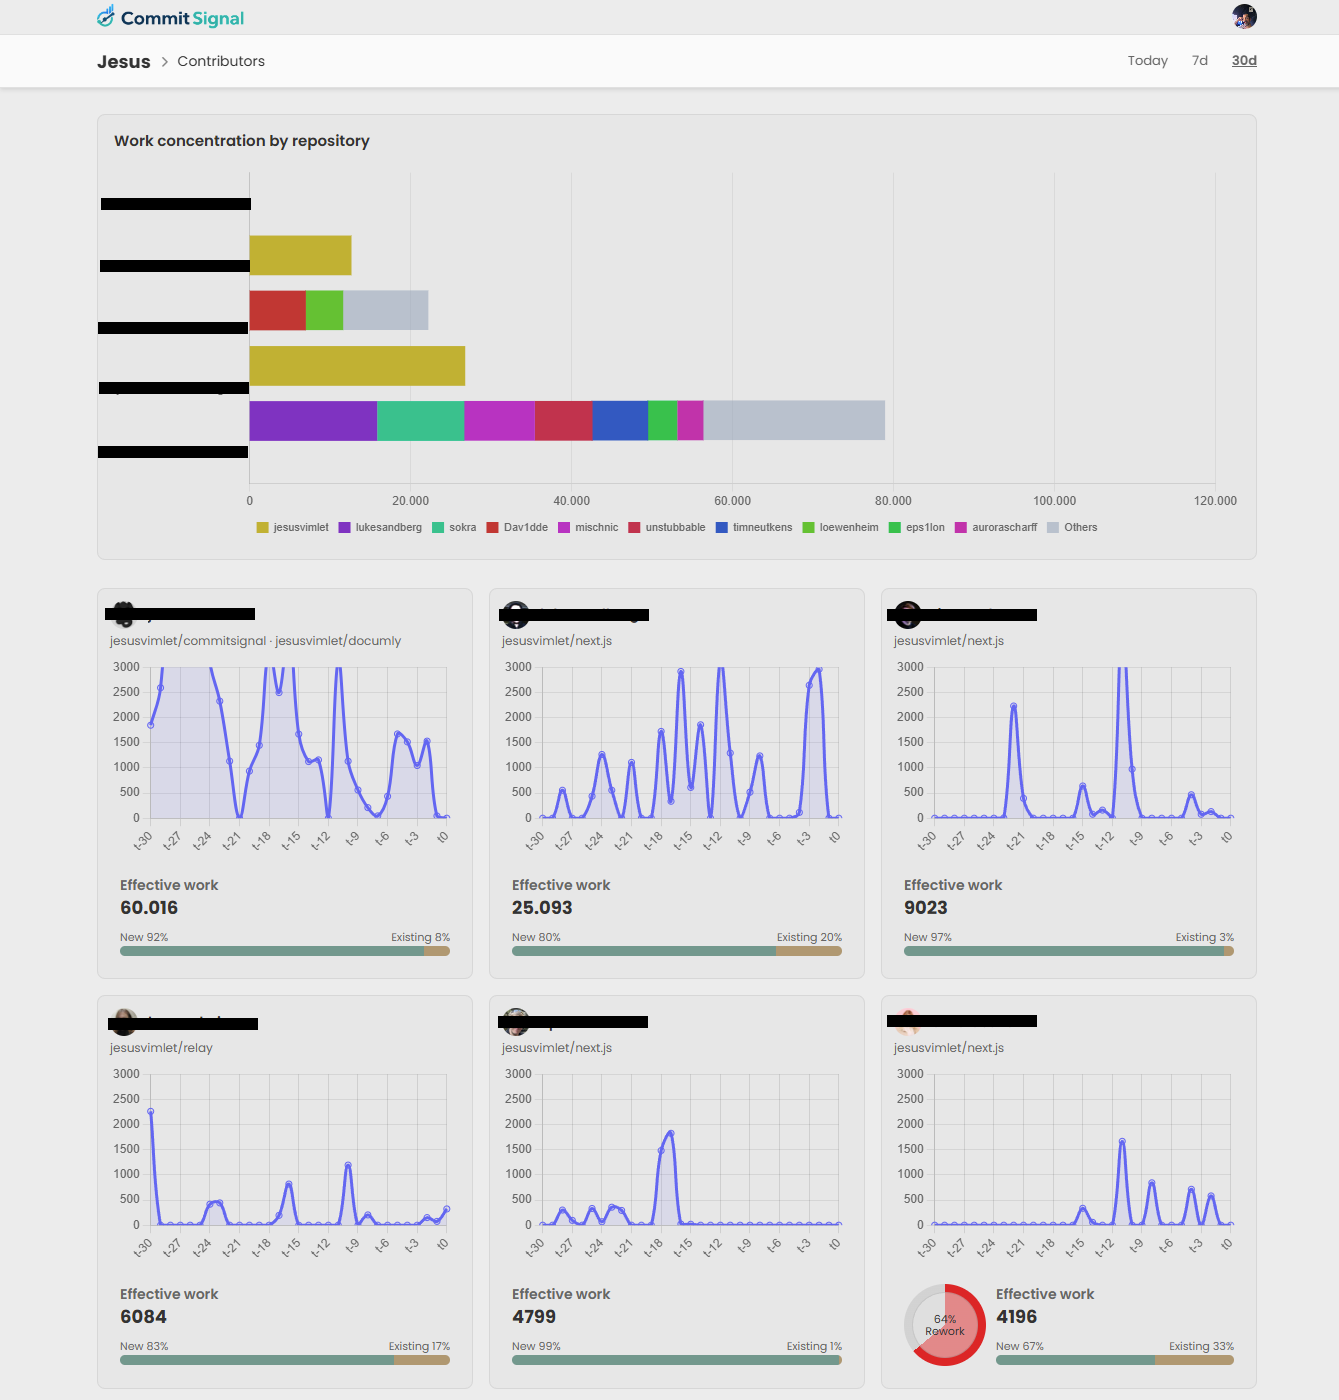
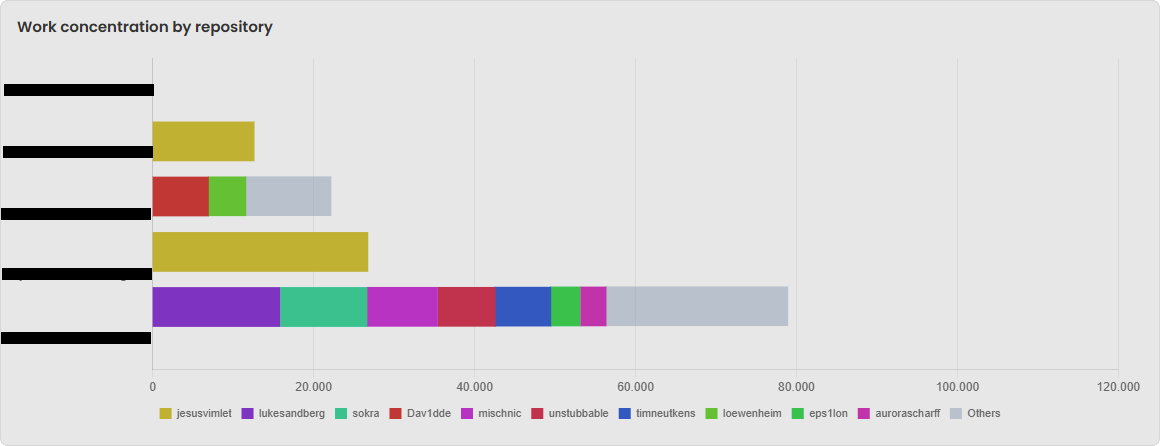
Work concentration by repository
Work Concentration by Repository shows how the strongest contribution activity is distributed across repositories. It helps you understand where the largest amount of effective work is currently concentrated and whether the distribution of effort reflects the structure and priorities of your organization.
Contributors list
Contributors list shows the activity and evolution of every contributor across the organization in a single place. Instead of looking at people inside individual repositories, it provides a broader view of contribution patterns across all projects.
It helps you quickly understand how effort changes over time, where meaningful work is happening, and how contribution is distributed throughout the organization.
Reading signals together
Introduction
Individual signals can be useful, but they become significantly more meaningful when read together. A single metric can reflect normal behavior depending on context, while combinations of signals often reveal patterns that explain what is actually happening inside a project.
Signal definitions
- Churn — Shows how much recently changed code is being touched again. It can indicate unstable implementation decisions or frequent adjustments in the same areas.
- Hotspot — Shows how concentrated delivery is in files or areas that are touched repeatedly. It can reveal pressure accumulating in a small part of the system, increasing dependency and bottleneck risk.
- Rework — Shows how much effort is spent revisiting recent work instead of extending it. It can indicate that forward progress is being replaced by correction loops.
Common signal patterns
| Pattern | Churn | Hotspot | Rework | May suggest |
|---|---|---|---|---|
| Strong instability | ↑ | ↑ | ↑ | Repeated changes in high-pressure areas combined with growing correction effort. |
| Concentrated iteration | ↑ | ↑ | — | Teams are refining critical areas while work still integrates cleanly. |
| Broad correction | ↑ | — | ↑ | Rework spreading across different areas, often driven by unclear requirements or handoffs. |
| Pressure concentration | — | ↑ | ↑ | Costly revisits accumulating around a smaller part of the system. |
| Exploration phase | ↑ | — | — | Active iteration without strong rework or concentration signals yet. |
| Delivery concentration | — | ↑ | — | Work is focusing on fewer areas, which may be expected depending on priorities. |
| Quality / alignment issue | — | — | ↑ | Progress is being replaced by repeated correction effort. |